

Finding Strong Stocks to Trade in a Weak Market
Finding Strong Stocks to Trade in a Weak Market
How to find strong stocks to trade or just finding stocks in general. Applies to both swing and day trading.


Here’s a post we wrote a few months ago but we updated it to make it more current. It’s got plenty of useful info and can help you learn how to find strong stocks even during this market dip!
Keep reading to find links to some of our own scanners that we use.
Also, stay tuned because we plan on sending a market update/stocks to watch email later today (hopefully, if we have time! No promises)
How to Find Stocks to Trade
There are many sites out there that can help you find stocks to trade. There's Trade Ideas, Finviz, TrendSpider, and TradingView just to name a few. Sometimes you can even just use social media to find stocks. Let's go over our process.
Currently, we mostly screen for stocks using Finviz, TrendSpider, and Twitter.
Screening with Finviz:
We usually look for momentum stocks on Finviz, similar to this momentum strategy here.
Step 1: Go to the Finviz Screener
Step 2: Click "technical" on the screener to screen for technical indicators.
Step 3: Put 0-3% below high in the "52-week high/low section". This is to ensure you are only screening strong stocks that are near their highs if you are a momentum trader. In a weak market, you can even set it to 0-5% or 0-10% below highs if not enough stocks are showing up.
Step 4: In "Performance" or "Performance 2", either one, put "Week Down". This will show you stocks that are down on the week. You don't always have to do this, but it can come in handy sometimes as the stocks will be down on the week but still close to their highs, which can prove to be a good short-term dip buy if the stock is strong enough. You can even select “Week Up” if you’re looking for stocks that managed to finish higher for the week in a weak market. That works too; it just depends on your strategy.
You also would probably want to select “average volume above 50k” in the “Descriptive” category. This will weed out illiquid stocks.
The screener should look like the image below. You can even click it and it'll take you directly to the screener, and you can add to it if you want more criteria.
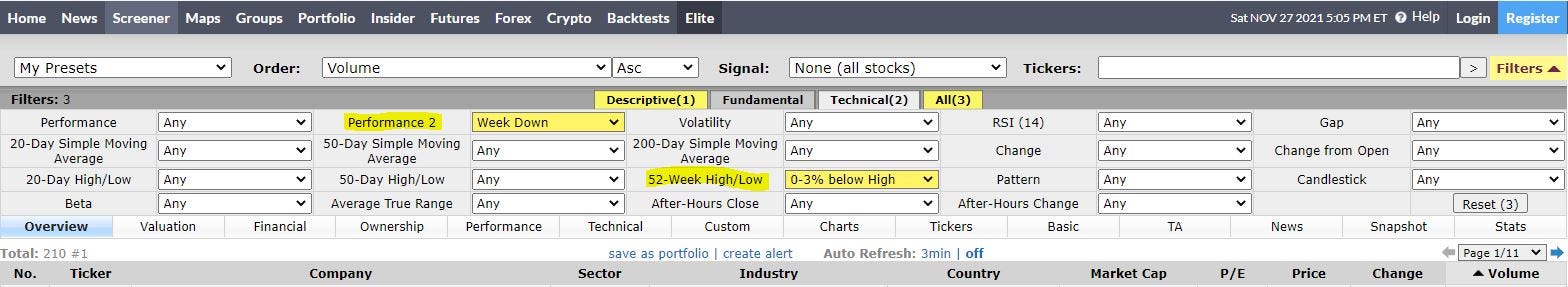
Step 5: Look at all the results. This particular scan gave us 210 tickers to look at, which we sorted by market cap. It's unlikely that you'll have to look through all 210 stocks to find 10 tradeable ones though, you'll probably find them relatively quickly.

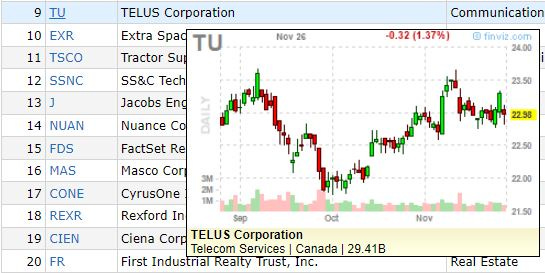
You can easily hover over a ticker and a mini chart will show up without you clicking on it (don't think this applies to the mobile site, however). This makes it easy to quickly look through stock charts. See the mini Telus ($TU) chart below.
A simple Finviz screen like this or a custom screen of your choice depending on your strategy can save you a good amount of time.
The same applies to bearish strategies. Instead of screening for 0-3% below highs, you can screen for 0-3%, 0-5%, or 0-10% above lows, depending on your preference. This will show you stocks that are relatively weak.
Finding Short Squeezes:
Another cool thing you can add is "Float Short" combined with the "0-10% below highs" filter. This will help you find stocks that are heavily shorted but are near 52-week highs and have momentum. We set the short float interest to over 20% in the image below, but even over 10% can work. This only populated 3 results, however, they are decent trade setups.

If you want to learn more about finding potential short squeezes before they happen, read this article here:
How to Predict a Stock Short Squeeze (UPDATED 2021)
Although Finviz is a useful free tool for screens, it is a bit limited in terms of complexity. So, let's discuss TrendSpider next since you can add much more complex criteria.
Screening With TrendSpider:
With TrendSpider, you can create complex criteria, or you can use someone else's criteria. We'll talk more about using other people's criteria later. For now, let's talk about creating a scanner.
After you make a TrendSpider account, you'll see the Market Scanner tab on the top right of your screen which you'd have to click on.

Then it'll take you to a blank screener that you can customize by clicking "add parameter here" highlighted in green. You can set crazy parameters that include timeframes spanning from the 1-minute time frame to the monthly time frame, which is why it's useful for both day trading and swing trading.

Below is an example of a relatively basic screener we made (but still more complex than the Finviz one) that we named "The Strong Stock Scanner". It aligns with our momentum strategy of the 9 EMA being higher than the 20 EMA, and the 20 EMA being higher than the 50 SMA, to indicate an uptrend.
Also, we filtered it to show stocks that are up on the day, and have at least 150,000 in trading volume. We use this scanner often.

However, if you don't want to make your own criteria, you can simply choose some preset ones as you can see below. There are many more options to choose from than the ones listed in the picture, but here's what "Complex mixed criteria example 1" looks like.
It incorporates the RSI indicator, Williams %R, Pivot Points, and Vortex. If you want to add to it or change it, all you have to do is make a copy of it by clicking "make your own copy" and then you're free to add or remove whatever you want from it.

Off topic, but you can also subscribe to public screeners. Here's what we mean.
Check out this tweet from @TrendSpider on Twitter:

All you have to do is click on the link they provided in the tweet, and then you can subscribe to that screener/scan. By subscribing, you'll not only have access to the screener, but every time it gets updated by the owner of the scan (@Trendspider_J), it'll get updated for you as well. If you want to though, you can easily make a copy of "Jake's volume shelf scan" and do whatever you like with it.
If you have a screener you want to share with the public, you can do that as well. In fact, here's our Strong Stock Scanner from earlier. Just take it and go!
After you've run a scan, you can see all the results on the right side of your screen and the corresponding chart on the left, which you can easily scroll through with your arrow key.
Here's an example of our Strong Stock Scanner to show you how a scan looks.

Finding Balloon Breakout Setups:
If you've looked through some of our past watch lists, you may have seen us post some "balloon raindrop breakout" charts. Well, how do we find them?
First, let's briefly introduce what a balloon raindrop is. Raindrops charts are volume-based candles/raindrops which you can read all about here. A balloon raindrop is simply a raindrop that looks like a balloon. See the raindrop we pointed out below.

This type of raindrop shows that volume was strong near the high end of the price range, which can be a good bullish signal. Combine it with a breakout, and you can have some good results.
But anyways, how do we find them? Well, it's simple.
We use our "balloon charts" scanner. This simple screener that we created simply looks for balloon raindrops that close above the 50 SMA on the daily time frame.
Then, we just look through each chart and look for breakouts or solid chart setups. It's definitely a useful tool that is unique to TrendSpider and we use it often. Oh, and here’s the link to it if you want to use it.
We wrote a more detailed article about Balloon Breakouts that you can read here:
How to Find and Trade Balloon Breakouts - Raindrop Candlestick Trading Strategy
We also do other scans for day trading such as scans that help us find red to green moves. If you want to learn more about this, read our article here:
How to Find and Trade a Red to Green Move - Stock Day Trading Strategy
Screening With Twitter:
This method requires a tiny amount of effort and it is still pretty effective. You could make a Twitter account that is dedicated to stocks only and just follow people that talk about stocks (like us, @StockBrosTrades), but you don't even have to do all that if you don't want to.
All you have to do is make a list on Twitter. If you don't know what a list is, it's just a list of accounts that you can group together to see their tweets specifically. For example, you can make a list named "Stock Charts" and add people that consistently post stock charts on Twitter to it (again, like us). But, you can make all kinds of lists for all kinds of reasons.
You can even discover new lists that others have created. Twitter recommends them based on your current lists/interests.

We have this list named "Stocks" that you can see below. When we click on it, it shows us all the most recent tweets of the people we put in the list. Often, we’ll see charts there and interesting trade ideas.
Imagine having a list of a bunch of people that post charts/trade ideas, or stock news, people are just doing the work for you. If you fill your lists with people who provide good value on Twitter, then it’s a solid alternative way to screen for stocks.
Maybe you don't even care about charts. Maybe you're just a contrarian trader that trades based on sentiment. That's perfect because creating a list of stock traders can help you gauge what the sentiment is for many retail traders on social media.
Adding people to a list is easy too. You just need to go to someone’s profile and click on add/remove from list, or you can click "edit list" in your current list and just search for usernames to add.
If you're a great trader though and have your own system, you're probably better off doing your own screens as we mentioned earlier. Using Twitter is good to get a general sense of some potential trade ideas but it shouldn't be relied on entirely unless your strategy is market sentiment related.
The Takeaway
As we mentioned at the beginning of the article, there are other great sites out there that can help you screen for stocks (like TradingView, which is 60% off right now). However, these are the ones we currently use the most as of right now.
1. Finviz: Relatively simple screens
2. TrendSpider: Simple or complex unique screens
3. Twitter: Get general ideas from others that you trust and/or gauge sentiment.
Thanks for reading! We hope the article was useful to you. If you enjoyed this article, consider sharing it and/or following us on Twitter @StockBrosTrades
Need Chart Software?
TrendSpider is currently 60% OFF for Black Friday and this deal won’t last much longer. Check it out here before it ends!