

You Don't Always Need Stop Losses in Trading. Here's the Proof
You Don't Always Need Stop Losses in Trading. Here's the Proof

For many traders, the golden rule is to let winners run and cut losses quickly, often via stop losses. There are many high-profile traders that swear by the stop loss, as it can limit losses dramatically, but there are even very successful traders that don’t use stop losses. So, do you really need one? The answer is: no, you don’t, depending on what strategy you use.
In this post, we’ll show why you don’t necessarily need to use a stop loss for this particular swing-trading strategy on the S&P 500 ETF (SPY) and Nasdaq 100 ETF (QQQ). We’ll also show how a stop loss can even hinder your gains and increase your risk (with this strategy).
Keep in mind, however, that although we sometimes don’t use stop losses on broad ETFs like the SPY, we almost always use them when trading individual stocks. This is because individual stocks are subject to company-specific risks, which could lead to intra-day sell-offs, as we saw with DLocal (DLO) stock recently, where its price was cut in half in the middle of the day due to a short-seller report. You would not want to be caught holding DLO in that scenario, so a stop loss would save you lots of money.

However, broad-market ETFs are generally more stable, so you wouldn’t need to worry about huge, random losses like that (as long as you don't overleverage!).
A Swing-Trading Strategy That Doesn’t Require a Stop Loss
A stop loss isn’t the only way to get out of a trade. You can get out if your profit level is reached or if your initial entry conditions aren’t valid anymore. So what are the entry conditions for this strategy? Using the 90-minute or 65-minute timeframe, go long SPY or QQQ when the price closes above the 30-period simple moving average (SMA) AND when the 10 SMA is above the 30 SMA. Both those criteria need to be met.
You can get out of the trade when the price either closes below the 30 SMA or when the 10 SMA crosses back under the 30 SMA, or when a profit target is hit.
We backtested these results using TrendSpider’s backtesting tool, which you can read about here. Here’s what this strategy looks like on the QQQ:
90-minute time frame:
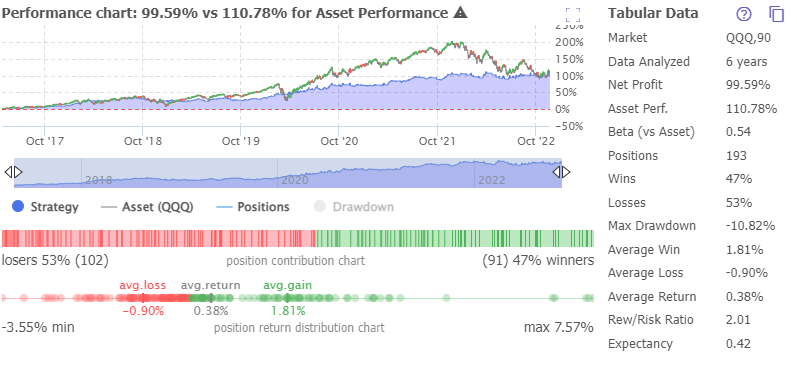
Now, the first thing you may notice is that the strategy slightly underperformed QQQ over a six-year period. However, notice how the strategy performed very well with minimal volatility? Its max drawdown was only 10.82%. Considering that QQQ was down almost 38% from its highs recently, that’s a very attractive performance. All of this was done without a normal stop loss. How? Because this strategy makes you close your position when the trade starts to head south, but it does it in a more strategic way.
But it gets better.
If you add a “take profit,” meaning that you close the trade whenever the trade reaches a certain level, then it boosts your returns and lowers your risk. For example, here’s what the same strategy looks like against QQQ if you added “take profit at 2% gain” as an extra exit condition on top of the ones mentioned above. Again, the chart below is analyzing the 90-minute time frame.
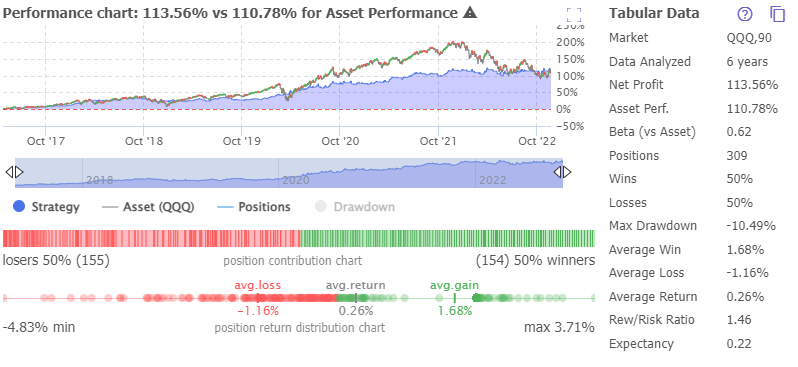
Now, the strategy is outperforming QQQ over this time frame, AND the max drawdown dropped to 10.49%. Talk about a solid risk-adjusted strategy! Even though the win percentage is 50%, the average win is 1.68% compared to 1.16% as the average loss, giving you a nice net profit over time.
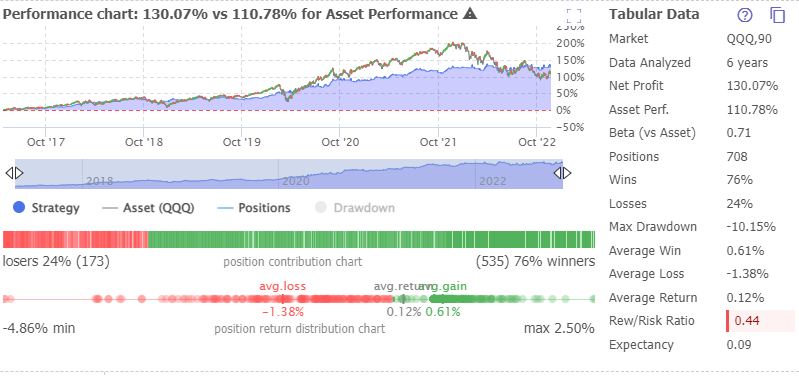
Interestingly, if you take profit at 0.5% instead of 2%, the max drawdown drops to 10.15%, and the gain increases to 130%. However, the number of positions taken increases from 309 to over 700, so you’d need to factor in extra commission costs. Also, with a win rate of 76%, this strategy may be psychologically easier for some traders to handle.
The strategy works on the SPY too since QQQ and SPY are highly correlated. Below is the same strategy from above on the 90-minute timeframe against the SPY and with a 1.5% take profit level. Again, steady returns and low volatility.

Using the 65-minute time frame:
For this strategy, the 65-minute time frame works as well, but for some reason, it wasn’t as good as the 90-minute one. Using a 65-minute time frame may sound odd, especially if you’re used to trading on the 1-hour time frame. However, it actually makes sense to use it, and we explain why in this article here.
Anyways, below is the 65-minute time frame against the SPY using the same strategy with the 1.5% take profit. Not as impressive, but it’s still a respectable low-volatility strategy.

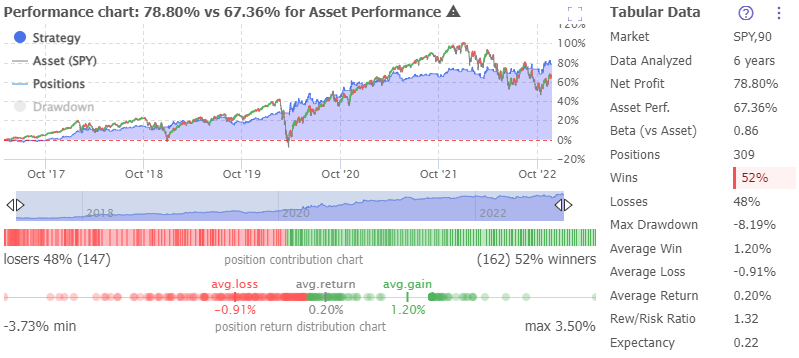
Adding a Stop Loss Could Kill Performance and Add Risk
It sounds pretty counterintuitive that a stop loss could add to your losses, but it’s definitely possible. Using the strategy above on the 90-minute time frame, we added an extra exit condition: a fixed stop loss at a 1% loss. Instead of a 77.96% return with an 8.19% max drawdown, the performance dropped to 54.88%, and the max drawdown actually increased to 9.05%. The numbers got worse the tighter you made the stop loss. There’s a takeaway from that: it may be better to give your trades breathing room rather than cutting losses very quickly at an arbitrary level.

What about trailing stop losses? For what it’s worth, trailing stop losses didn’t really work that well in the backtests, either.
Shorting Using This Strategy
This strategy has the potential to outperform in a bear market as well, and generally, shorting an ETF is safer than shorting an individual stock because you won’t wake up to a +50% gap-up day on the SPY. Again, you just need to watch your margin levels.
For a short entry, you’d just need to flip the criteria. Therefore, the entry conditions are: short when both the price closes under the 10 SMA and when the 10 SMA is under the 30 SMA.
The exit conditions are ANY of the following: Price closes above the 10 SMA, 10 SMA is above 30 SMA.
For this example on the SPY, we used the 65-minute time frame and used a take-profit level of 1.5%. Below are the results. Despite the SPY’s positive performance over 5 years, you’d be in the green shorting it, especially during the two bear markets. If you’re able to spot downtrends, then you could use this strategy only when the market has a downward bias (like it does now), which could dramatically boost your returns.

The Takeaway: You Don’t Always Need Stop Losses
Depending on how you trade and which tickers you trade, you don’t always need a stop loss. The strategies above, including the short-selling strategy, don’t use stop losses. In fact, adding tight stop losses to the backtests would often make the returns much smaller and make the max drawdown bigger (a bit counterintuitive). Still, keep in mind, these strategies may be much riskier on an individual stock without a stop loss, and they also generally don’t work as well outside of ETFs (we tested them).
Also, if you feel like you can’t go without a stop loss (for extreme scenarios), a 4% or 5% stop loss level on these tickers is likely loose enough to not let the strategy get faked out all the time while also providing peace of mind that you have a set stop loss level. Here’s an example below on the SPY using a 5% stop loss level. As you can see, it didn’t affect the performance of the backtest compared to the same example above. The number of positions and every other number stayed the same, meaning that the strategy itself stopped you out every time before even reaching a preset 5% stop loss.
Finally, please note that past performance is not indicative of future results, backtests are for informational purposes only. Just because a strategy worked well in the past, it doesn't mean it will work well now.
Check out some of our other strategy backtest articles here:
Read: How to Backtest a Stock Trading Strategy - No Coding Required
Read: Shorting Growth Stocks - Backtesting a Moving Average Strategy on ARKK
Read: Does the Relative Strength Index (RSI) Indicator Really Work? Let's Backtest It
If you want to play with TrendSpider’s strategy tester yourself, now’s a good time because it’s currently 60% off for Black Friday for a short period of time! And we definitely wouldn’t promote something we don’t believe in. But TrendSpider has more than just backtesting, it’s good for scanning for trade setups, using raindrop candles, creating trading bots that automatically trade for you via your brokerage, options flow, alerts, and much more. So check it out!

Thanks for reading. We hope you found this useful.
If there are any stocks/topics you’d like us to cover, hit us up!
Email: info@stockbrosresearch.com
Twitter @StockBrosTrades